
Agricultural Market News
- All news
- Grain Market
- Oilseed market
- Premium Data
- Livestock News
- Company News
- Economy
- Food industry
- Logistics
- Inputs


from
to

Trump considers suspending Moroccan fertilizers duties amid corn grower pressure
14 new markets have opened for Ukrainian food since the beginning of the year

“Smart” animal collars will change US farming

BLACK SEA GRAIN. KYIV: Join with a SMART rate by March 31!
UkrAgroConsult
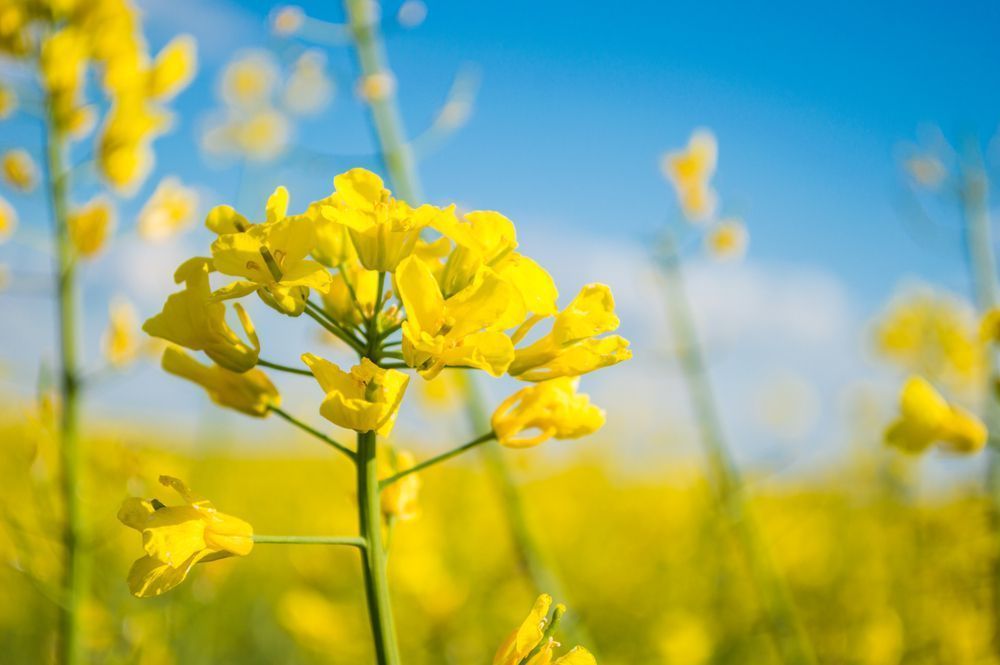
Romania Rapeseed Market Enters Phase of High Yield Potential and Price Adjustment

European tractor market will recover only in 2027 due to Chinese pressure

Sunseed prices in Ukraine reached 31,000 UAH/t, but they are limited by the stabil...
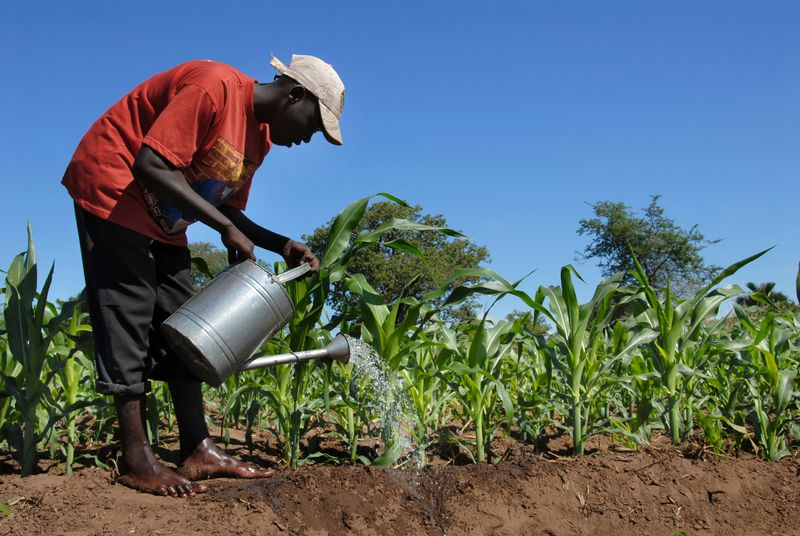
Kenya expects record grain harvest

Iran opens Strait of Hormuz to ships of “non-hostile countries”
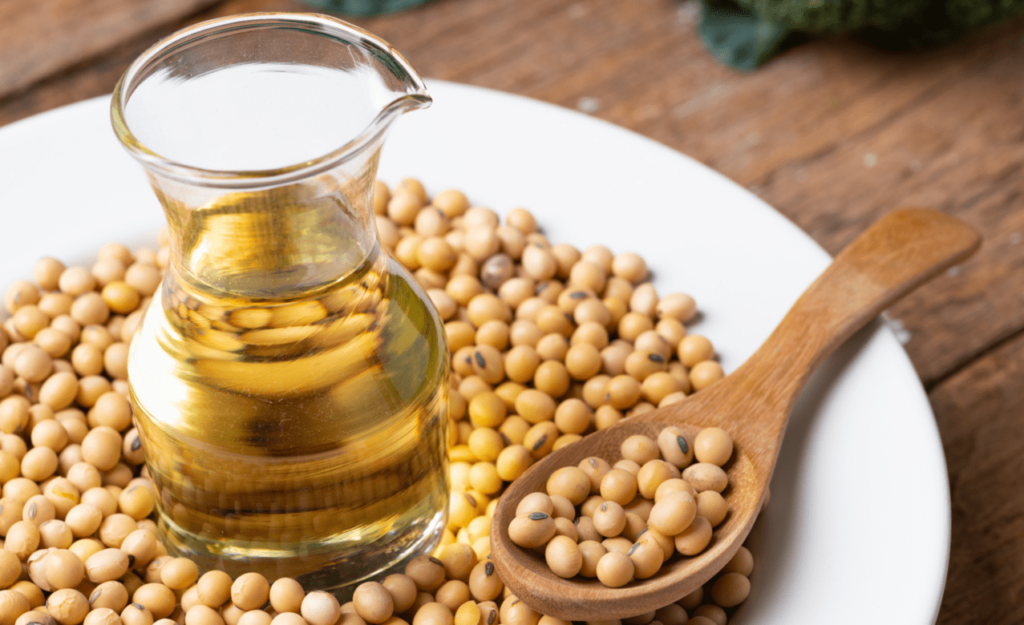
Global soybean processing volumes in MY 2025/26 exceed experts’ expectations

French government intends to provide assistance to the country’s farmers ami...

UN food program supplier buys stolen Ukrainian grain

Got additional questions?
We will be happy to assist!
Write to us
Our manager will contact you soon