
Impacts and Repercussions of Price Increases on the Global Fertilizer Market
Global fertilizer prices are at near record levels and may remain elevated throughout 2022 and beyond. Fertilizer prices account for nearly one-fifth of U.S. farm cash costs, with an even greater share for corn and wheat producers. Fertilizer accounts for 36 percent of a farmer’s operating costs for corn, and 35 percent for wheat. These elevated prices could have implications for crop production in 2022 and 2023.The Russian invasion of Ukraine has exacerbated the already limited fertilizer supply situation and has triggered import-export restrictions that will compound shortage concerns.
The United States is a significant producer of nitrogen and phosphorus yet imports large quantities of potassium-based fertilizers. Although fertilizer prices began increasing in 2021, many U.S. producers were able to avoid the later surge in fertilizer prices caused by Russia’s invasion of Ukraine, because fertilizers for 2022 plantings were purchased in 2021. However, as the Russia-Ukraine war continues, the impact of fertilizer prices could likely take a heavier toll on 2023 agricultural production decisions, domestically and abroad.
This report examines the global fertilizer landscape, with a focus on the three main macro-fertilizer groups—nitrogen, phosphorus, and potassium (NPK). We look at (1) the major suppliers; (2) the major users; (3) the major exporters and importers; (4) the impact of the Russian invasion of Ukraine; and (5) discuss how the United States fares relative to other countries.
Introduction
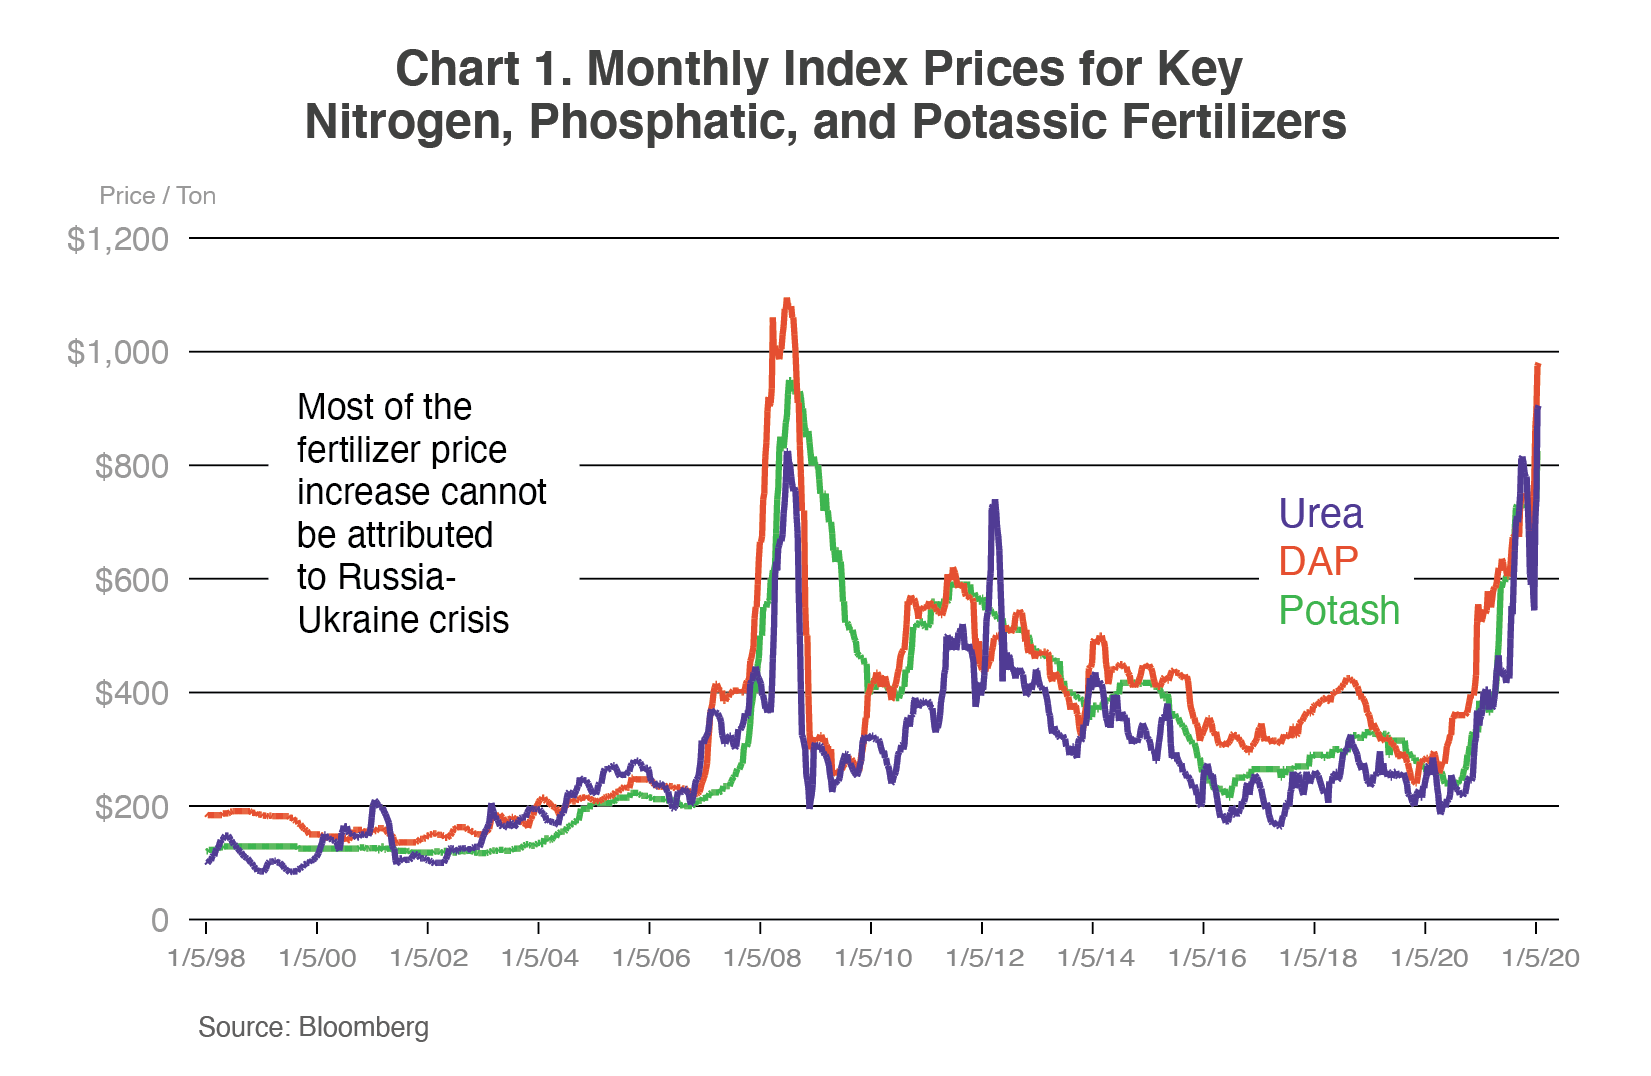
Current fertilizer price increases are reminiscent of the Great Recession period (Chart 1), when prices nearly doubled across all major fertilizer groups at the end of 2007. At that time, fertilizer prices were fueled by rising demand in many emerging markets, increased use of corn and other crops for biofuel production in the United States, Brazil, and Europe, the surge in energy prices, and Chinese fertilizer export tariffs. However, fertilizer price increases during the Great Recession were short-lived once the demand for fertilizer fell, due to a decline in global agricultural trade coupled with slowing economic growth and low commodity prices.
Much like the period of the Great Recession, similar issues have fueled higher fertilizer prices in 2022. Global fertilizer demand remains strong. Some countries have reduced their fertilizer use since 2007, but many have continued to increase their crop nutrient use. While the United States’ share of global fertilizer demand has dropped from 20 percent to 10 percent since 2007, many of the emerging markets have stepped up their use of fertilizers.
The surge in natural gas prices in the middle of 2021, especially in Europe, resulted in a reduction in producing ammonia—a key input of nitrogen fertilizer production. Coal price increases in China also led to a rationing of electricity usage, causing some fertilizer production plants to decrease production. This resulted in China imposing a quota on fertilizer exports, particularly phosphates, until June 2022, citing the need to ensure domestic availability and food security. China’s suspension of fertilizer exports significantly diminished the global supply.
Numerous factors have worsened existing supply chain disruptions caused by COVID-19. These include export restrictions enacted by Russia and China, plus international sanctions on Belarus and on Russia. Russia and its ally, Belarus, are both major fertilizer suppliers to the global market. Recently, many countries have imposed restrictions on Russian imports. In response, Russia imposed initial restrictions on nitrogen and complex nitrogen fertilizer exports through June 2022. As of May 23, 2022, the Russian government increased the current six-month quotas on some fertilizer exports. Thus, expanding nitrogen fertilizers by 231 thousand tons to 5.7 million tons, and expanding complex or compound nitrogen-containing fertilizers by 466 thousand tons to 5.6 million tons. A decree released on June 1, 2022, codified the Russian government’s intent to maintain fertilizer export quotas through the end of 2022. Supply issues may contribute to elevated fertilizer prices for a prolonged period, as the conflict between Russia and Ukraine continues.
Fertilizer Supply Outlook
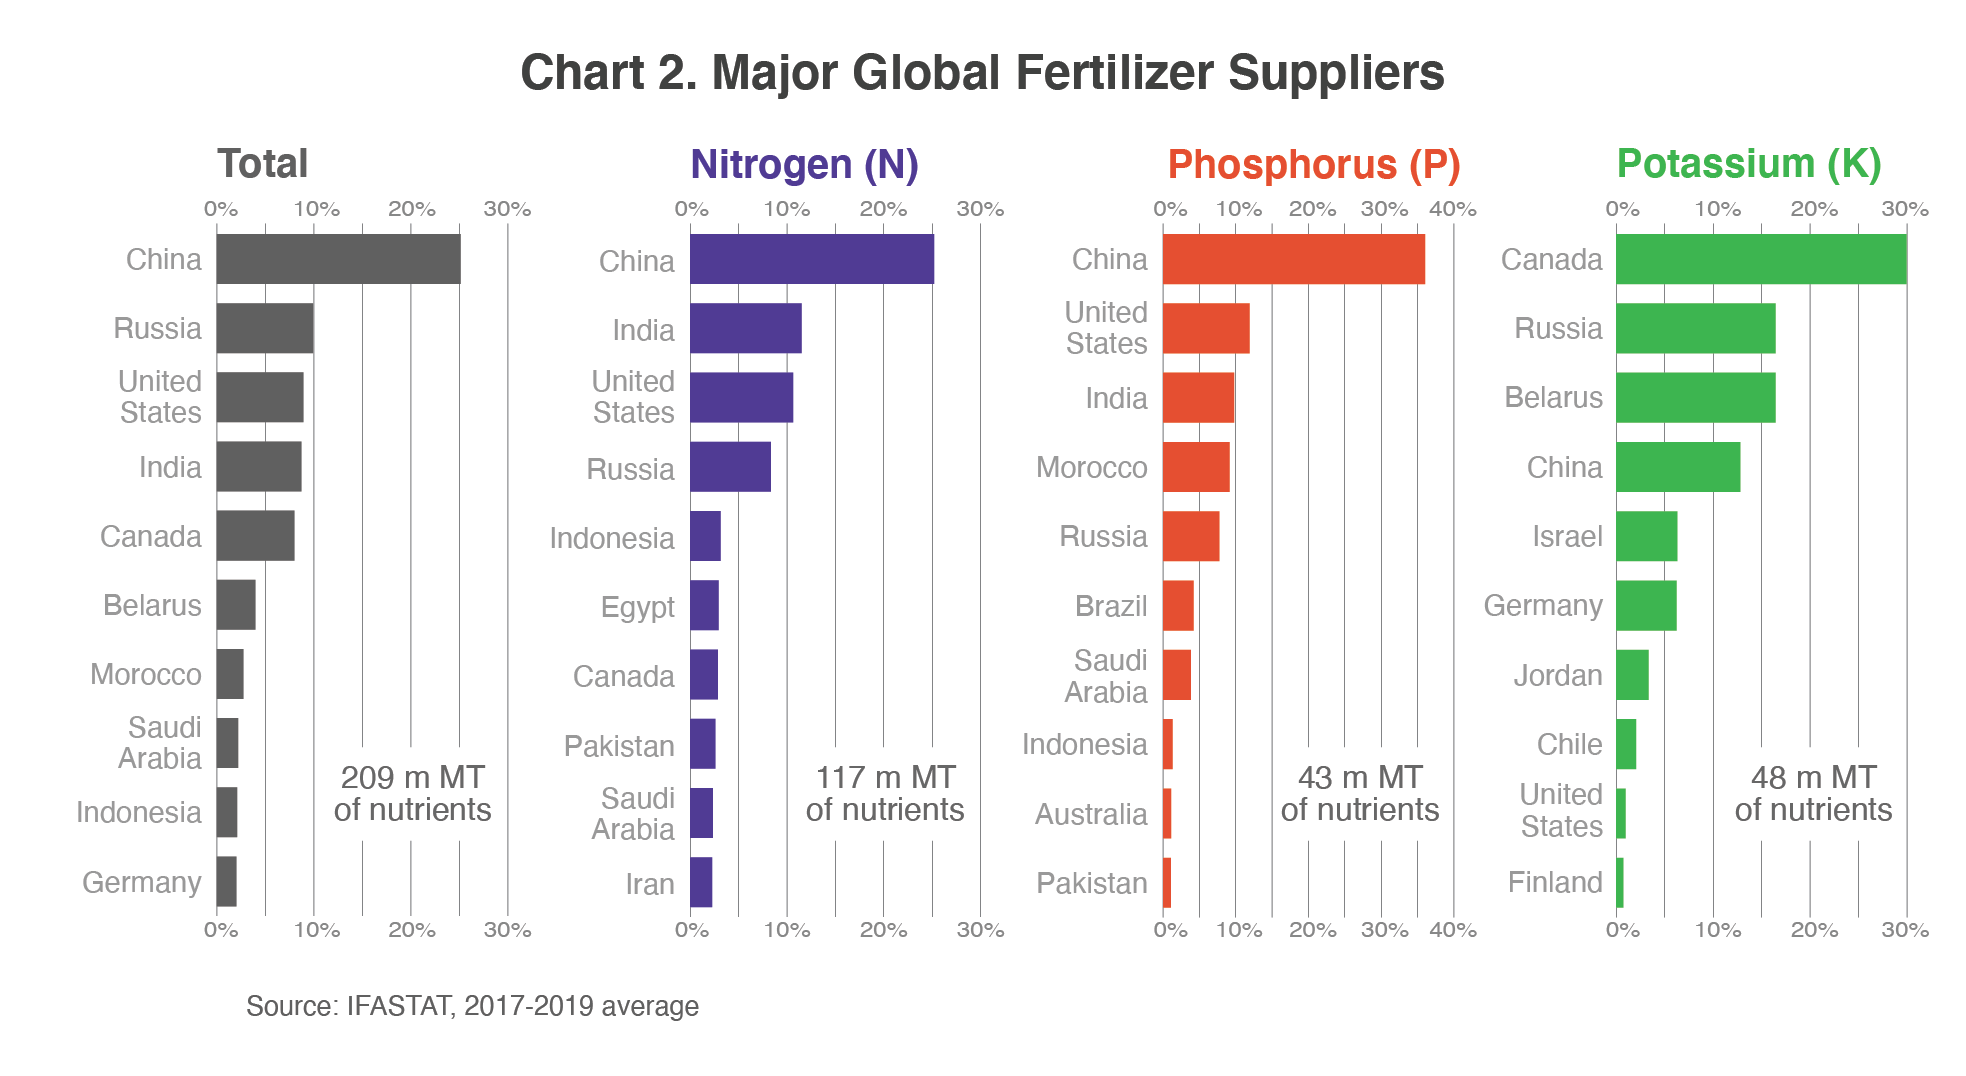
Combined, China, Russia, the United States, India, and Canada produce more than 60 percent of the world’s fertilizer nutrients (Chart 2). Russia and the United States each produce less than 10 percent of global fertilizers, while China produces approximately 25 percent. The degree of concentration in production increases with individual components of the NPK complex. Ten countries produce 71, 86, and 95 percent of N, P, and K fertilizer, respectively.
Nitrogen fertilizers are primarily made from nitrogen in the air and produced by the Haber-Bosch process. The Haber-Bosch process is the main industrial procedure to produce ammonia, combining nitrogen from the air with hydrogen under extremely high pressures and temperatures. The process requires lots of natural gas. Given the availability and price of natural gas, many countries are limited in their capability to engage in such extensive production.
Phosphorus and potassium are mined minerals; such reserves are not available in many countries. China produces more than one-third of the world’s phosphorus, followed by the United States, India, Morocco, and Russia, respectively. Combined, these five countries produce more than three-quarters of the global supply of phosphorus.
Potassium production is the most concentrated. Two-thirds of all potassium reserves are supplied by only three countries: Canada, Russia, and Belarus. Canada produces approximately one-third of the global potassium supply, while Russia and Belarus combined produce the other third. Because crop production uses these three macro fertilizers in some combination, almost every country relies on obtaining their fertilizers from the few countries with available fertilizers.
Where and How are Fertilizers Used?
Although fertilizer production is highly concentrated, fertilizer use is dictated by soil composition and the crop being produced. As a result, fertilizer use is widely distributed globally (Chart 3). Some countries are heavier users of fertilizers on a per hectare basis than others. Based on the 3-year average data (2017-2019) from the International Fertilizer Association (IFA), China is the largest user of fertilizer, using nearly one-quarter of global fertilizer supplies. India, another large fertilizer producer, is the second largest user. Much of India’s usage is fueled by the Indian Government’s heavy subsidization of fertilizers. The United States accounts for approximately 10 percent of global fertilizer usage with most of it being used in grains and oilseed production. The share of global usage of individual NPK components does not significantly differ from the share of overall fertilizer use.
A country’s fertilizer usage is affected by many factors, including, but not limited to the type of crop, and a fertilizer’s price, availability, and adoption rate. China is the largest consumer of fertilizer on a per hectare basis, consuming more than 340 kilograms. Brazil is the second largest user, consuming 246 kilograms per hectare, nearly twice what is consumed by the United States. Sub-Saharan Africa (SSA) remains the smallest consumer of fertilizer, consuming less than 20 kilograms per hectare on average.
Fertilizer usage does not only vary by country and by crop, but also by the method of application (Table 1). Most of the direct application of ammonia happens in North America. Fourteen percent of all U.S. fertilizer application is in the form of direct ammonia, which accounts for nearly one-quarter of all nitrogen fertilizer application. Mexico and Canada apply 11 and 10 percent of their fertilizers as direct ammonia, respectively. Ammonia accounts for 17 and 16 percent of Mexico and Canada’s used nitrogen, respectively. Ammonia is typically used in grain production’s pre-planting stage. Brazil, Argentina, and China have yet to adopt direct ammonia application. Australia’s use of direct ammonia is negligible. China continues to be a heavy user of blended fertilizers, consuming nearly half of its fertilizer in some combination of nitrogen, phosphorus, and potassium.
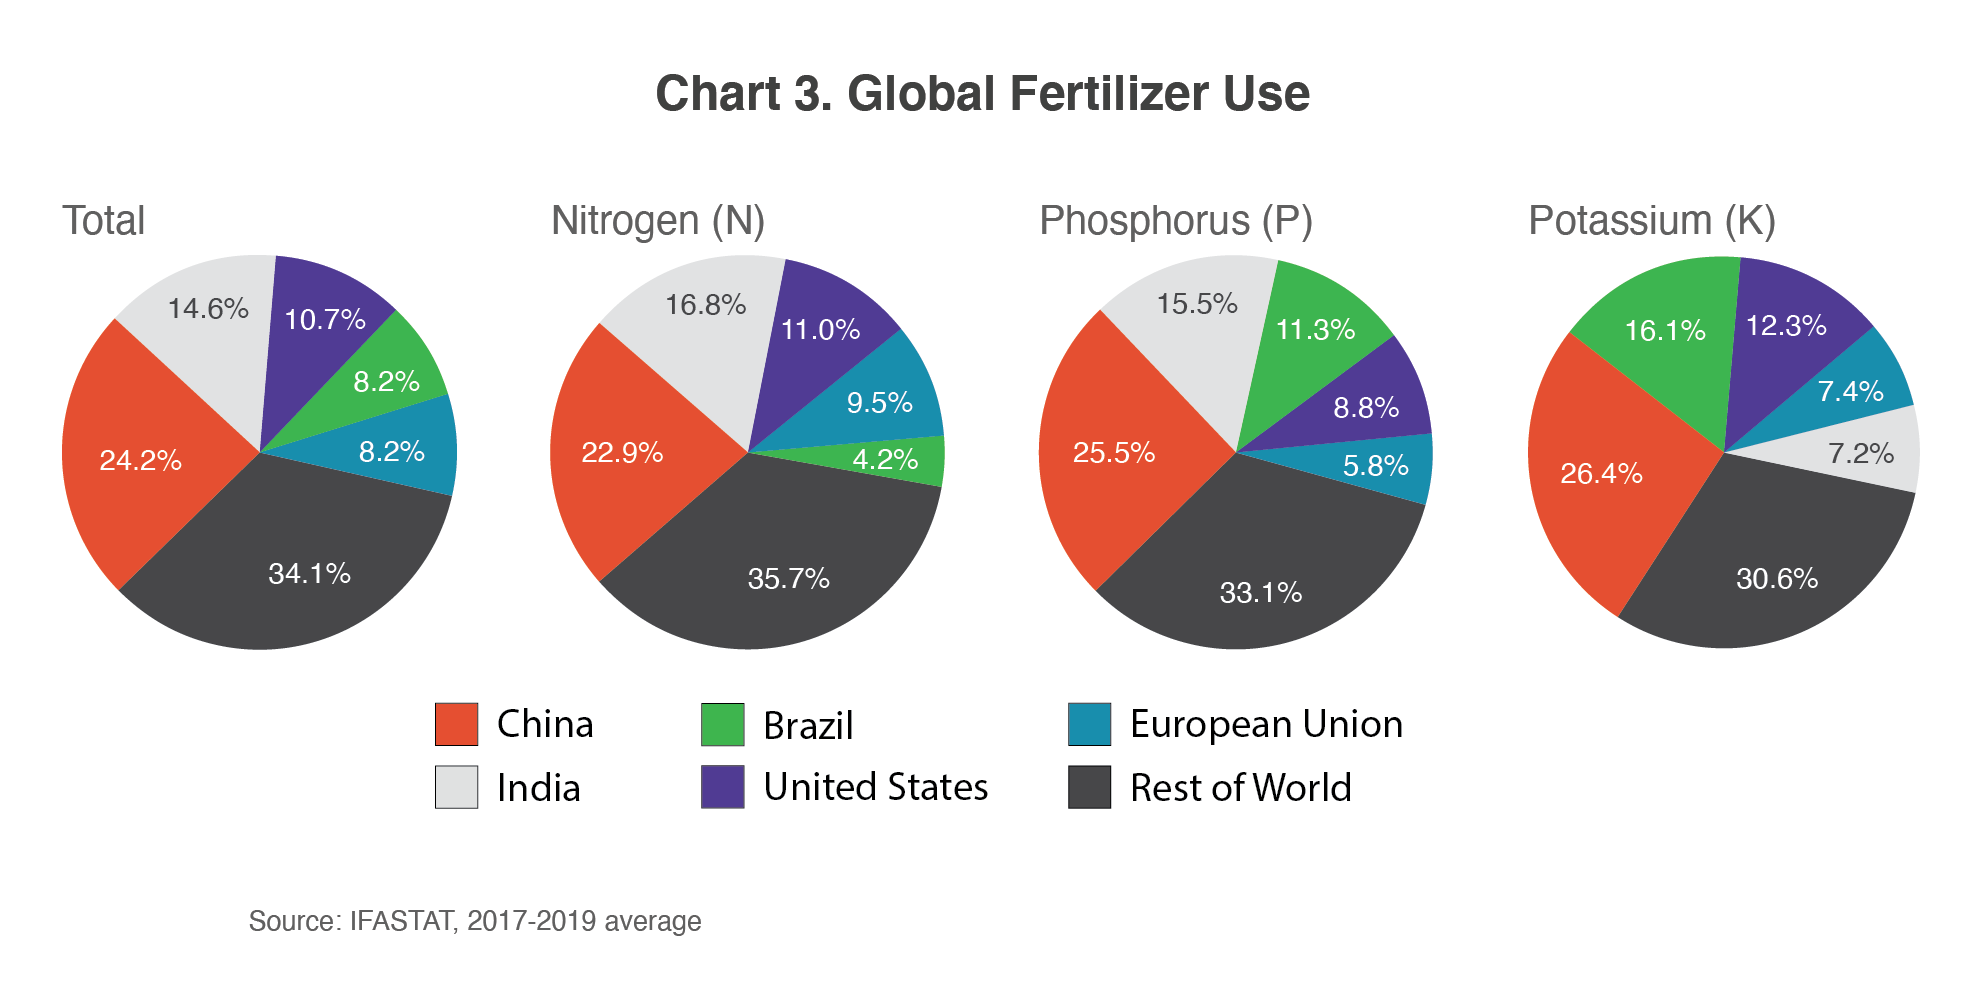
Table 1. Fertilizer Application and Use by Country
| Country | Direct Ammonia Application | % Nitrogen that is direct Ammonia Application | Urea as a percent of total fertilizer | Compound as a share of total fertilizers |
| Argentina | 0% | 0% | 13% | 15% |
| Australia | 1% | 2% | 11% | 12% |
| Brazil | 0% | 0% | 5% | 11% |
| Canada | 10% | 16% | 11% | 10% |
| United States | 14% | 24% | 5% | 15% |
| China | 0% | 0% | 6% | 44% |
| Mexico | 11% | 17% | 11% | 11% |
| South Africa | 0% | 0% | 8% | 30% |
| Other Africa | 0% | 0% | 11% | 17% |
Source: FAOSTAT
Major Fertilizer Exporters and Importers
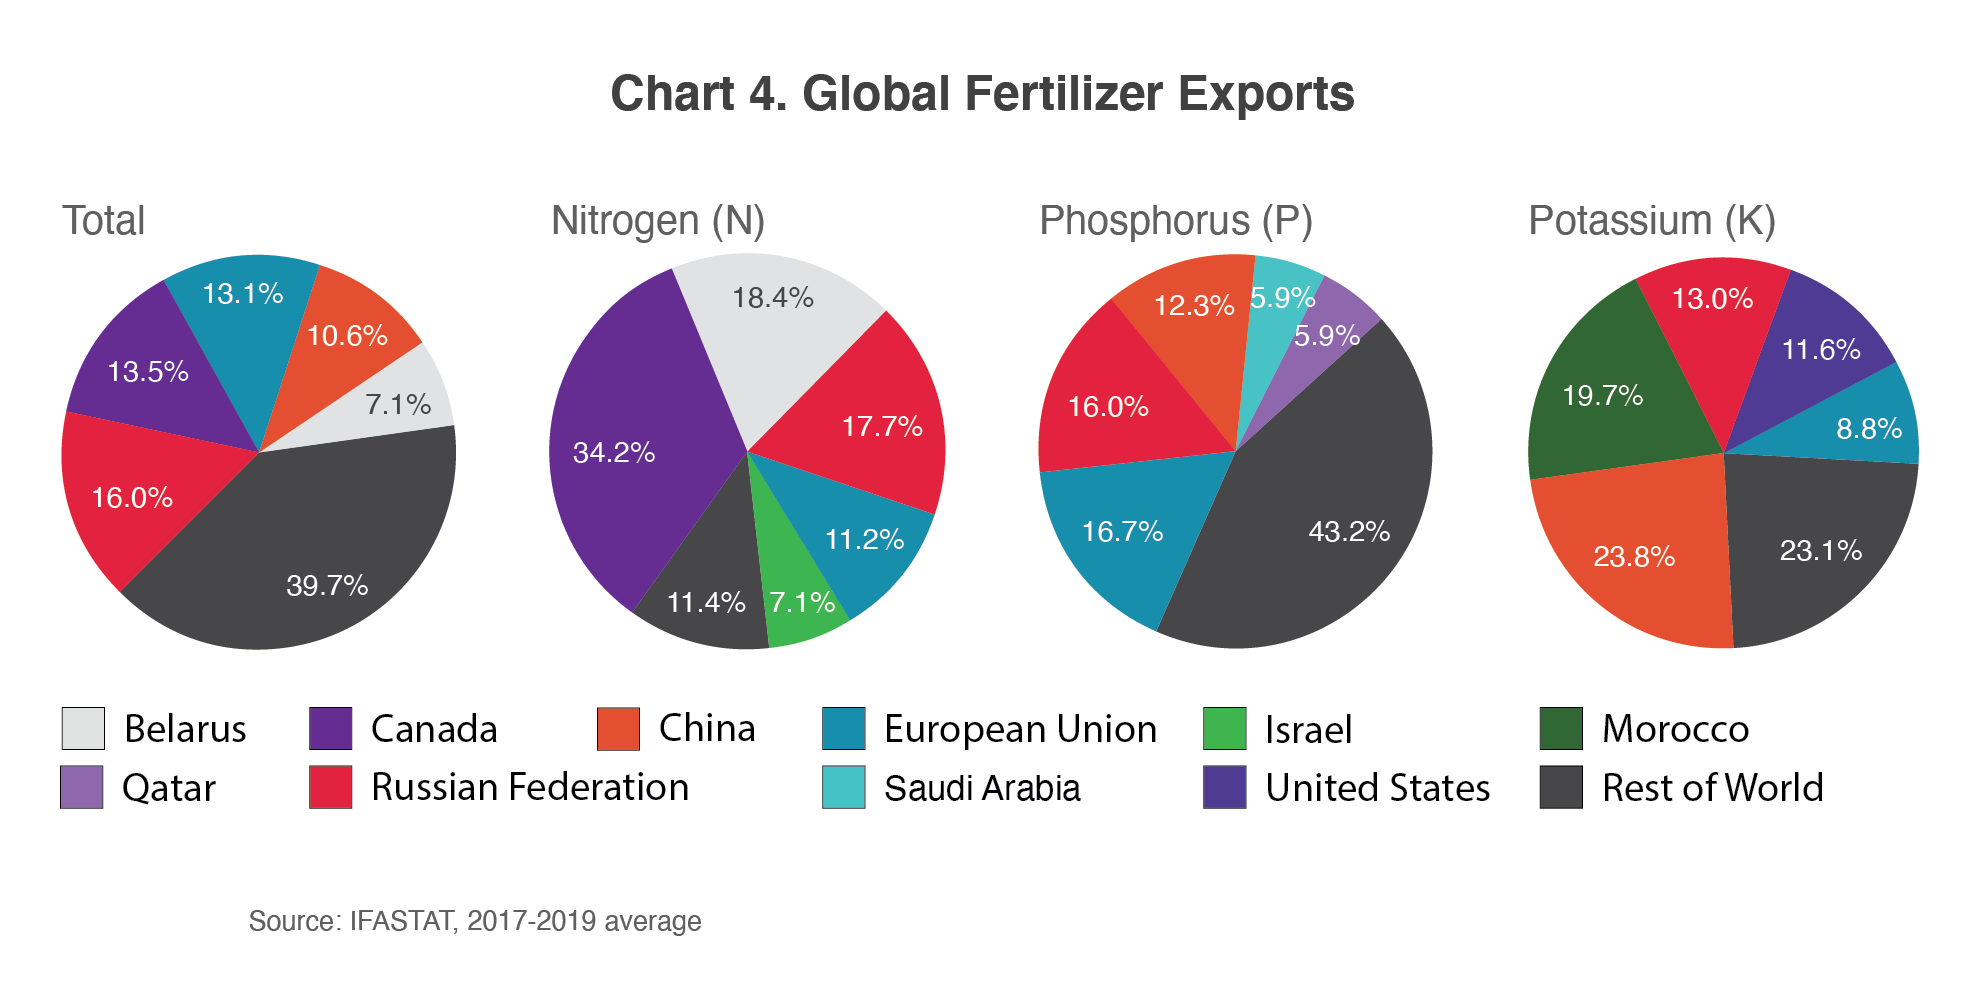
The main fertilizer exporters fall along the line of the highly concentrated producers (Chart 4). The fertilizer sector is vulnerable to disruptions, because there are few exporters. Five countries/regions export more than 60 percent of all fertilizers—Russia, Canada, the European Union, China, and Belarus. Five countries/regions export approximately 60 percent of nitrogen fertilizers—the European Union, China, Russia, Qatar, and Saudi Arabia Five countries/regions export more than 75 percent of phosphorus fertilizers—China, Russia, the European Union, Morocco, and the United States. Five countries/regions export more than 90 percent of potassium fertilizers—Canada, Russia, Belarus, Morocco, and the United States. Russia and Belarus command nearly 25 percent of the global export market share of all fertilizers. Combined, they supply more than one-third of global potassium exports, a vital product that few other countries have at their disposal on which most countries rely to make fertilizer blends. However, Canada is the largest exporter of potassium fertilizers, accounting for approximately 35 percent of all exports. Disruptions from any of these major exporters may cause significant fertilizer shortages and increases in prices.
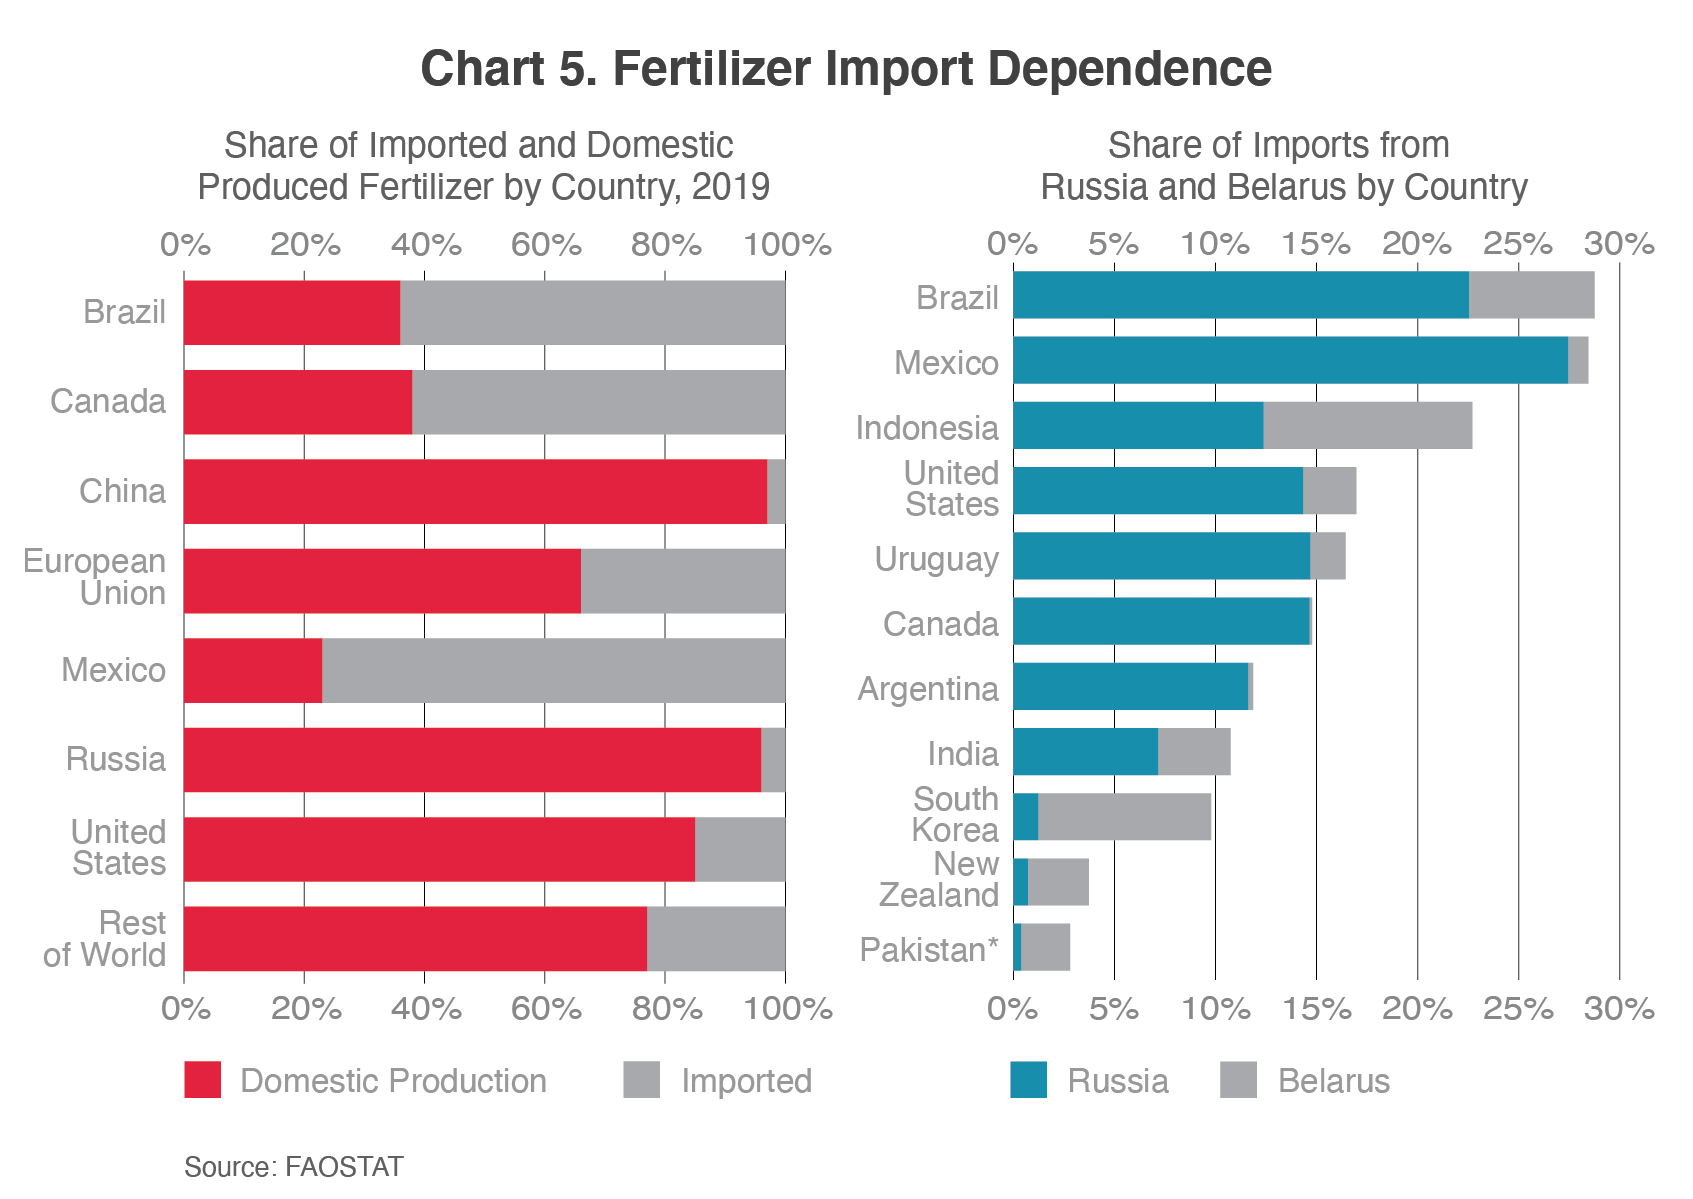
Fertilizer imports are normally dictated by a country’s crop production area, and the type of crops being produced. A country’s blending facilities influences its imports, since it needs nitrogen, phosphorus, and potassium to manufacture blended fertilizers. Large crop producing areas—such as Brazil, Canada, and Mexico—heavily depend on imported fertilizers; Brazil, Canada, and Mexico each import more than 60 percent of their fertilizer. The United States imports nearly 20 percent of all its fertilizer, despite producing a significant amount of nitrogen and phosphate fertilizers. Much of its imports are potassium-based fertilizers, but it also imports nitrogen and phosphorus. Some of these imports are likely being used by manufacturing and blending facilities to make compound fertilizers, some of which are re-exported (Chart 5).
Except for the aforementioned countries, the rest of the world imports approximately 25 percent of its fertilizer. The relatively small volume of imports is likely due to two factors. First, most of the countries in the ‘rest of the world’ category have low fertilizer application rates. In comparison, on a per hectare basis, Sub-Saharan Africa (SSA) uses 7 percent of the fertilizer used by the United States and 5 percent of the fertilizer used by China. Second, Qatar, Saudi Arabia, and Iran are in the top ten global nitrogen producers, while Morocco is a leading phosphorus producer.
Russia and Belarus play critical roles in the global fertilizer market, accounting for nearly 20 percent of global exports. Mexico and Brazil receive more than 25 percent of their imports from Russia and Belarus—a considerable dependency. The United States purchases 14 percent of its imported fertilizer from Russia and 3 percent from Belarus. Because Russia and Belarus are two of the limited suppliers of potassium-based fertilizers, economic sanctions on Russia and direct sanctions on Belarusian potash are negatively impacting the global potash supply.
Impact of Russia’s Invasion of Ukraine
The geopolitical conflict between Russia and Ukraine is impacting global supply of fertilizers and food. Russia originally imposed restrictions on nitrogen, phosphate, and potash fertilizer exports until June 2022, effectively removing nearly 15 percent of the global supply. Although these restrictions were announced, the actual imposition of the restrictions is unclear, because Russia stopped publishing trade data. According to Trade Data Monitor, there are no records of fertilizer exports from Russia since January 2022. However, many countries, including the United States and Brazil, have reported fertilizer imports from Russia through April 2022. The uncertainty surrounding Russia’s fertilizer supply will likely cause prices to remain elevated until the Russia-Ukraine war ends, because ramping up fertilizer production takes an average of three to five years if the necessary reserves are available. However, phosphate and potash reserves are limited in several countries.
Some countries have imposed import restrictions as a part of their sanctions on Russia. On April 8, the European Union imposed quotas on importing certain fertilizers as a part of a package of sanctions. Although these sanctions will not take effect before July 2022, they are likely to maintain and increase pressure on the global fertilizer market. The United States has also imposed restrictions on Russia, restricting access to pipeline parts and other inputs that may be vital in their fertilizer production process. However, although the European Union and the United States have some sanctions on Belarusian fertilizers, the United States has no direct sanctions on Russian fertilizers.
Russia’s invasion of Ukraine has resulted in a halt in Ukrainian fertilizer production. Although Ukraine is a relatively small fertilizer producer, according to the International Fertilizer Association, it produced 1.58 million metric tons of fertilizer in 2019 and supplied more than 75 percent of its domestic nitrogen consumption. In addition, in 2021, 65 percent of Ukrainian imported fertilizers came from Russia and Belarus. Although Ukrainian farmers continue to plant crops in 2022, their available fertilizers were mainly purchased in 2021. Given Ukraine’s position as a major grain and oilseed exporter, fertilizer shortages could further decrease Ukrainian production, which would have impacts on global food security.
Implications of Fertilizer Price Increases for the United States and the World
The increase in fertilizer prices has strained U.S. producers and in other countries. While the United States produces a significant amount of nitrogen and phosphorus, it imports a significant amount of fertilizer, especially potassium fertilizer. However, the global shortage of fertilizer is likely to keep fertilizer prices elevated in the United States.
Although fertilizer prices began rising in 2021, many U.S. producers were able to avoid the surge in fertilizer prices, because the fertilizers used for this year’s planting season were purchased in 2021. Cases in which fertilizer was purchased in 2022, many producers had to appropriately adjust their fertilizer mixes to match the planted crop acreage, minimizing their fertilizer expenditures. Some producers may have increased their soybean, acreage planting because soybeans require less fertilizer. This is because soybeans have a natural nitrogen fixing capability. The decision also reduces the acreage necessary to plant corn and other grains. Nitrogen fertilizer tends to be used for corn and other grains more so than other row crops. In response to high input costs, some producers may have chosen to reduce the overall acreage planted, while others chose to maintain acreage but change crop mix or modify other practices. Given the current relatively high prices of commodities—corn, wheat, and soybeans—reasonable profit margins are possible, despite the high input (fertilizer) prices.
Producers in other countries are faced with similar decisions as the United States. Brazil has already experienced a 15-percent year-over-year reduction in first quarter 2022 fertilizer imports. This could negatively impact its second corn crop production for 2022. The SSA countries have already seen a reduction in their fertilizer use due to the short supplies, low stocks, and high prices. The SSA countries already have very low fertilizer application rates. Reducing these rates further could negatively impact crop yields, threatening food security for some of the more vulnerable populations.
The global outlook for 2023 may be even more dire. As the Russia-Ukraine war continues and the supply of fertilizer remains limited, high prices are likely to have a more profound impact on 2023 planting decisions. Producers in the United States may be able to increase production, despite commodity prices remaining high, but will have to grapple with the expectedly high input prices for commodities.
Read also
Ukraine’s Ministry of Agrarian Policy resumes operations after government re...
Wheat prices in Moldova rise due to logistics disruptions in the Azov and Black Seas
US drought and China’s aggressive buying are pushing up soybean prices
Export logistics problems send wheat prices down at Russian ports
Malaysia to test B100 palm biodiesel on agricultural machinery

Got additional questions?
We will be happy to assist!
Write to us
Our manager will contact you soon