
The changing structure of global wheat market & implications for Australian grain users

The structure of the global wheat market is changing as Black Sea suppliers become increasingly influential players in the world wheat trade.
Last year, wheat exports out of the Black Sea ports from Ukrainian and Russian suppliers accounted for 39 percent of world trade, up from as little as 5pc two decades ago.
After a difficult decade of transitioning to a more market-oriented economy, the Black Sea region began to produce an exportable surplus around 2000.
At the same time as productivity improved in the farm sector with the adoption of new varieties and modern farming practices, they made significant investments in port infrastructure to enable large volumes of exports.
This has seen this region become a very competitive low-cost supplier of milling wheat to the world.
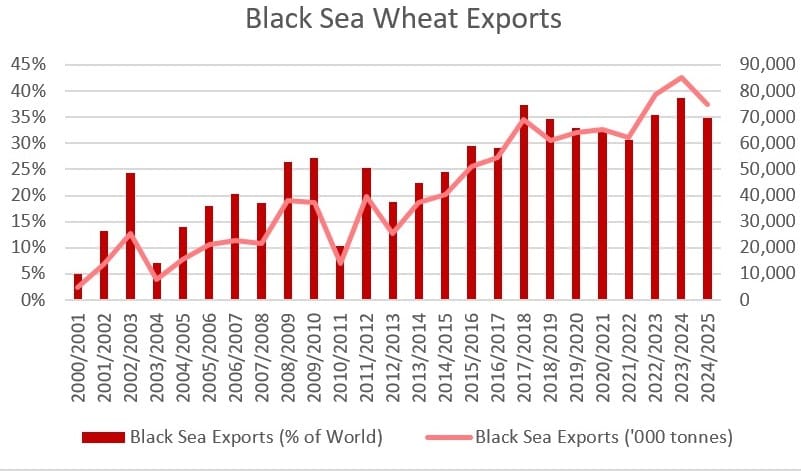
Source: United States Department of Agriculture (USDA)
This chart shows annual export volumes from Black Sea countries and the percentage of world trade of these exports.
In the past few years, the global wheat complex has been dominated by happenings in the Black Sea.
Firstly, prices rose to record levels on fears that the Russia-Ukraine conflict would restrict wheat exports from the region only to tumble as low-cost milling wheat poured out of Black Sea ports.
The emergence of Black Sea exporters has two major implications for the global wheat trade:
- Firstly, export availability and hence prices are more volatile (Russia has been quick to impose export quotas or even bans during times of drought or domestic food inflation); and,
- Secondly, the need for cashflow and the lack of storage infrastructure means that they are very willing harvest sellers, leading to increased pressure on global wheat prices following the Black Sea harvest.
The impact of these is illustrated by comparing the seasonality of global wheat prices in recent years compared to when Black Sea exporters were not so prominent.
Both the five-year and 10-year seasonality charts show that global wheat prices peaked in May as a risk premium is built into prices through the Northern Hemisphere spring, before falling into August on Black Sea harvest selling and then recovering into our harvest as northern hemisphere selling abates.
This contrasts with the 20-year pattern which showed much less volatility in prices throughout the year when a greater percentage of world trade was controlled by suppliers such as the EU, Australia and the US that held stocks and exported year-round.
The adage that prices are cheaper at harvest doesn’t ring true for Southern Hemisphere suppliers.
Contributing just 20pc of world grain supplies, the Southern Hemisphere harvest just doesn’t move the needle on global prices in most years.
In most years, global grain prices rise into the Southern Hemisphere grain harvest as the influence of northern hemisphere selling slows.
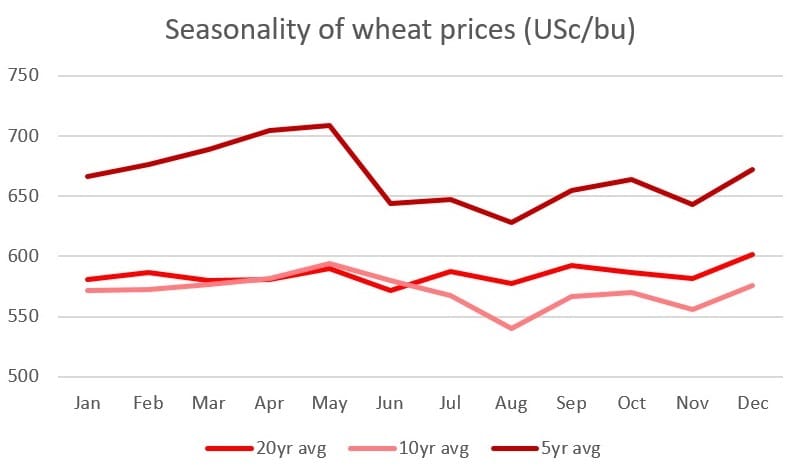
Source: Chicago Board of Trade (CBOT)
This chart shows the seasonality in the nearby futures chart over a five-year, 10-year and 20-year period.
So what does this mean if I’m an Aussie grain end user? I’ll want to cover my forward needs as much as possible in the June-August window while Russian harvest selling is depressing global prices.
This has the dual effect of taking advantage of lower global grain prices and ensuring you are not exposed to local basis risk through the Australian spring (possibility that local grain prices rise vis-a-vis international prices).
I’ll also want to make sure I’m covered through the Northern Hemisphere spring period of March-May, when wheat-market volatility tends to increase.
This will also protect the local end-user from being exposed to basis risk through the local autumn when problems with planting can often see Australian prices rise vis-a-vis international prices.
So should end-users be buying? Yes.
Anytime growers in the northern grain zone have access to grain at world prices they should be looking to extend cover.
Given that you are competing in world markets against global grain feeders, it’s not how much grain prices are that’s the question, it’s how competitive local grain prices are compared to international values.
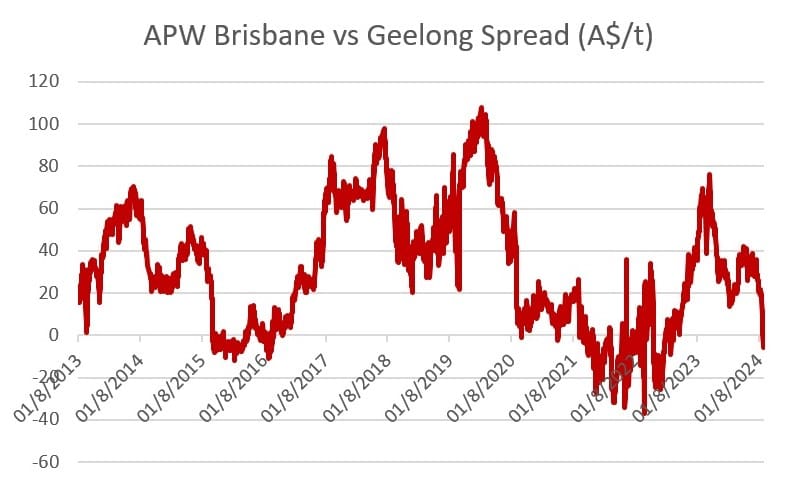
Source: ProFarmer & LSEG Workstation
This chart shows the difference between Brisbane port zone wheat compared to wheat at Geelong port zone.
With the northern zone looking at an exportable surplus of grain this year, northern growers will have access to grain at export parity values rather than at southern or west coast prices plus freight which is normally the case.
Finally, while wheat prices have moved strongly in your favour so far this year, both Europe and Black Sea exporters have less wheat to export in 2024-25, so at some stage they will stop selling.
Stocks in the hands of the major exporters are the tightest they have been in many years; however, the normal relationship between stocks and prices has weakened the past few years.
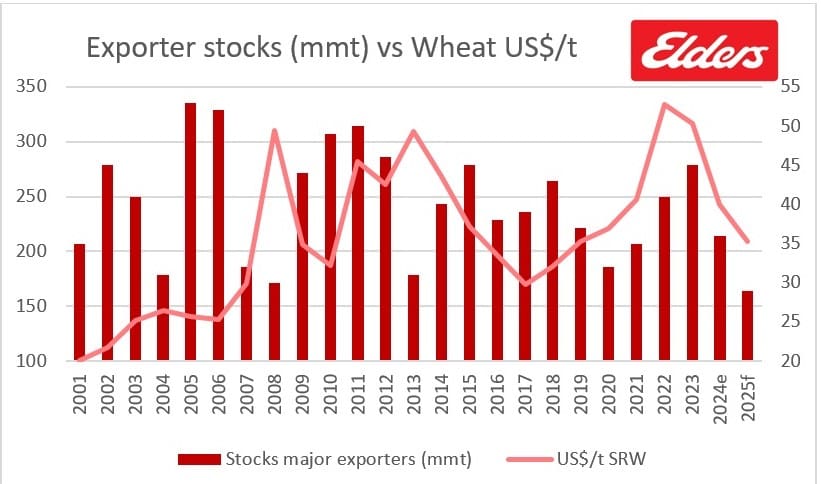
Source: United States Department of Agriculture (USDA)
As Black Sea harvest selling slows, we should see this relationship between stocks and prices restored and prices move higher.
It won’t take much to prick the interest of importers: the Argentine wheat crop is under pressure from dry weather and frost and there is talk of the need for significant Indian purchases to restore government stockholdings and quell high domestic wheat prices.
Read also
War with Iran and dry weather in the US are pushing up US wheat prices, but they a...
Sunseed prices have risen in Ukraine
China sees rising wheat auction clearance rates amid strong demand
Uzbekistan to ease raw material imports for sunflower oil and other products
BLACK SEA GRAIN. KYIV: Join with a SMART rate by March 31!


Got additional questions?
We will be happy to assist!
Write to us
Our manager will contact you soon